
If you've ever opened the twitter activity dashboard and felt unsure about what the numbers actually mean, you're not alone. Many users focus only on likes, reposts, and replies while missing several valuable metrics that reveal how people interact with their content. Understanding these numbers can help you make smarter posting decisions, improve engagement, and get more value from every tweet you publish.
What Is the Twitter Activity Dashboard?
The Twitter Activity Dashboard is a built-in analytics section that shows how your posts perform over time. It provides information about impressions, engagement rates, profile visits, link clicks, follows, and more.
While many people check it occasionally, very few take the time to understand what each metric represents and how it can be used to improve results.
Below are seven important metrics that deserve more attention.
1. Tweet Impressions Show Your Real Visibility
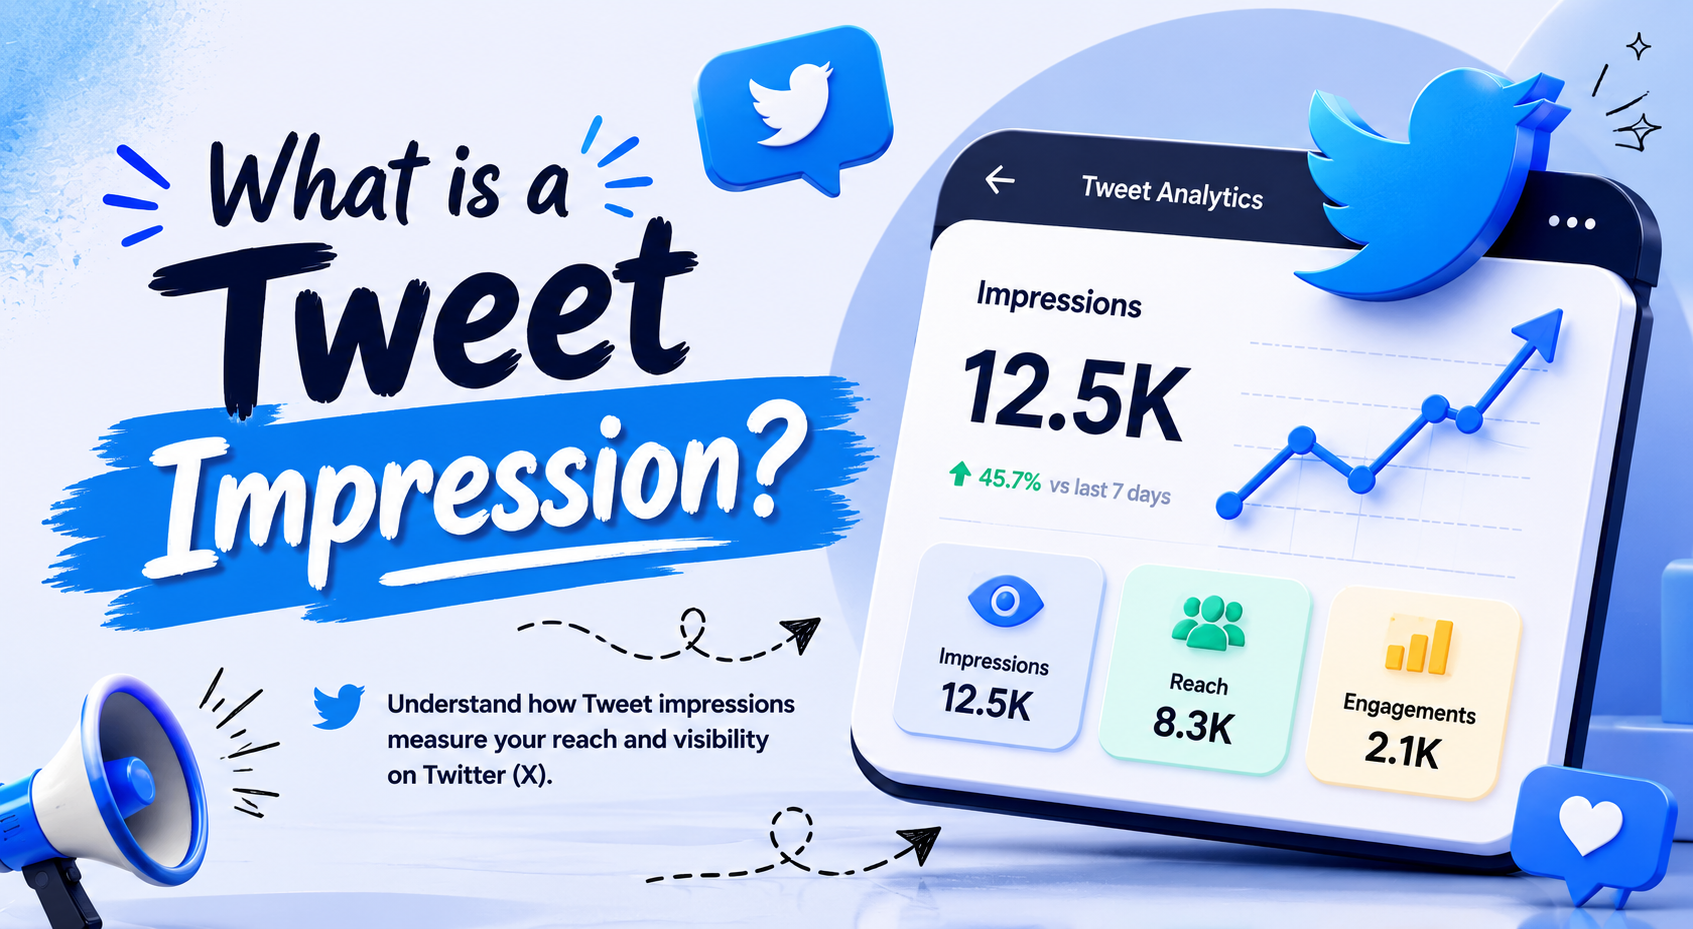
Many users ask, what is a tweet impression and why it matters.
A tweet impression is counted every time your post appears on someone's screen. It doesn't mean they clicked, liked, or shared the post. It simply means the tweet was displayed.
This metric helps you understand how many people had the opportunity to see your content. If impressions are high but engagement is low, your content may need stronger messaging or a more compelling opening line.
2. Engagement Rate Tells a Bigger Story Than Likes
Likes are easy to track, but engagement rate provides a more complete picture.
This metric measures the percentage of people who interacted with your tweet after seeing it. Interactions can include:
- Likes
- Replies
- Reposts
- Link clicks
- Profile visits
- Media clicks
A smaller audience with a strong engagement rate is often more valuable than a large audience that rarely interacts.
3. Profile Visits Reveal Growing Interest
When someone visits your profile after seeing a tweet, it shows genuine curiosity.
A steady increase in profile visits often means your content is encouraging people to learn more about you or your brand. If profile visits are growing but followers remain flat, consider updating your profile description, banner, or pinned post.
4. Link Clicks Measure Action
If your goal is website traffic, newsletter signups, or product sales, link clicks are one of the most important metrics available.
A tweet with fewer impressions can still outperform a viral post if it generates more clicks and meaningful actions.
Pay attention to the wording of your call-to-action and compare different posting styles to see what works most effectively.
5. Follower Growth Highlights Content Trends
The dashboard also shows when followers are gained or lost.
Instead of looking at total follower count, review the content published around periods of growth. Patterns often emerge quickly.
You may notice that certain topics, formats, or posting styles attract more followers than others.
6. Posting Time Affects Performance
Many users constantly search for the best time twitter users are most active.
The reality is that every audience behaves differently. Your dashboard can help identify when your followers engage most frequently.
Review the performance of your top tweets and look for timing patterns. You may find that posts published during specific hours consistently generate stronger engagement than others.
Testing different schedules over several weeks usually provides the clearest answer.
7. Media Engagement Often Gets Overlooked
Images, GIFs, videos, and other visual elements can significantly affect performance.
The dashboard tracks media interactions separately, helping you understand whether visuals are encouraging users to spend more time with your content.
Comparing text-only posts against media-based posts can reveal opportunities for better engagement.
Common Tools Users Search For
As users become more active on the platform, they often look for additional tools and resources.
Some people search for a twitter blocked you generator when they want to know whether another account has blocked them. Others look for a twitter post generator to help create posts more efficiently and maintain consistency.
While these tools can be useful for specific purposes, understanding your own analytics should remain a priority. The data inside your dashboard provides direct feedback from your audience and can help guide future content decisions.
How Xholic AI Helps Content Creators Stay Consistent
Creating content regularly can be challenging, especially when managing multiple campaigns or accounts.
At Xholic AI, the focus is on helping users organize content ideas, plan posting schedules, and maintain consistency across their social presence. When combined with the information available in the Twitter Activity Dashboard, a structured content approach can make it easier to identify what resonates with your audience and what needs adjustment.
Final Thoughts
Most users check impressions and likes, then move on. However, the Twitter Activity Dashboard contains far more useful information than many realize. Metrics such as engagement rate, profile visits, link clicks, follower growth, posting times, and media interactions provide valuable clues about audience behavior.
By paying closer attention to these numbers and reviewing them regularly, you can make informed decisions, improve content performance, and build stronger connections with your audience over time.